


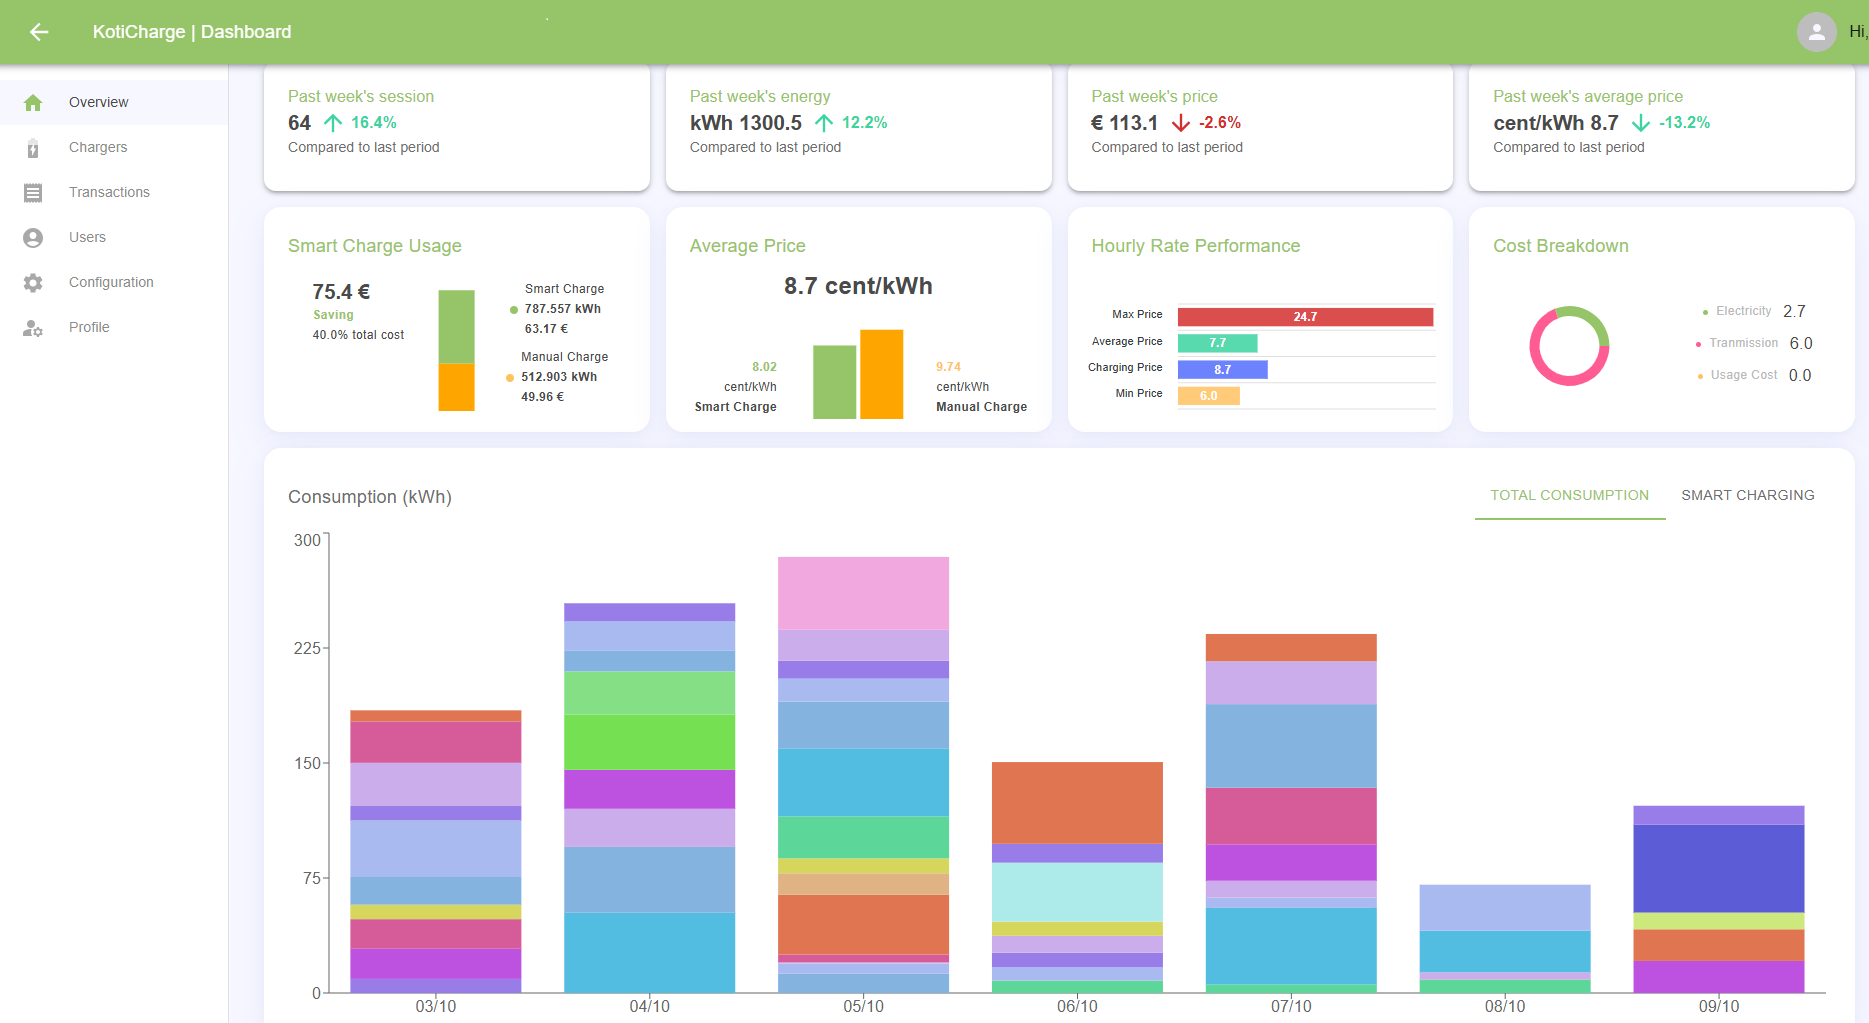
1. Real-Time Overview of Charging Activity
The dashboard home screen provides an at-a-glance summary of all charging activity within the selected property group. To have an interactive access to KotiCharge’s electricity dashboard, any KotiCharge’s users can access through this link https://dashboard.koticharge.fi/#/app/overview
-
Past week’s sessions, energy, and revenue are clearly shown with percentage changes from the previous period.
-
This helps housing managers instantly understand usage trends, detect inactivity, or spot technical issues without checking each charger manually.
Benefit: Saves time and provides transparency on overall EV charging performance across all tenants.
2. Group Selection for Multi-Site Management
The dropdown “Select Group” function allows managers to switch easily between different housing complexes or parking areas.
-
Perfect for housing associations managing multiple properties under one account.
-
Enables a centralized view of all charging stations without logging into multiple systems.
Benefit: Simplifies portfolio management — ideal for housing companies or property service providers.
3. Smart Charge vs. Manual Charge Tracking
The section “Smart Charge Usage” shows savings, total kWh, and cost differences between Smart Charge and Manual Charge modes.
-
Smart Charging optimizes charging times based on electricity price variations.
-
Housing managers can quantify energy and cost savings achieved through smart load balancing.
Benefit: Demonstrates cost efficiency and environmental responsibility to residents and boards.
4. Average Price and Hourly Rate Performance
The dashboard displays:
-
Average price per kWh (Smart and Manual)
-
Hourly rate performance with minimum, maximum, and average prices
This helps property managers understand electricity cost behavior and evaluate how time-based pricing affects tenant costs.
Benefit: Facilitates better communication with residents on pricing policies and supports fair cost allocation.
5. Cost Breakdown Visualization
A pie chart clearly divides total costs into components such as electricity, transmission, and usage cost.
-
This level of transparency is essential for housing cooperatives and condominium boards who need to justify shared electricity expenses.
Benefit: Simplifies billing reconciliation and supports transparent reporting to residents or financial committees.
6. Energy Consumption Summary (kWh)
Below the main widgets, the dashboard provides detailed consumption figures, showing total and Smart Charging energy use.
-
Housing managers can track total energy consumption trends across buildings or time periods.
-
Useful for sustainability reporting or comparing EV load against total building energy use.
Benefit: Enables data-driven energy planning and supports green building certification efforts.
7. User and Transaction Management (Sidebar)
From the sidebar:
-
Users: Manage resident accounts, assign access, or view individual charging activity.
-
Transactions: Review past charging sessions for auditing or billing.
-
Configuration: Adjust pricing or charger settings as needed.
Benefit: Provides administrative control and flexibility to align charging management with housing policies or resident agreements.
Why These Features Matter to Housing Managers
The KotiCharge dashboard provides operational clarity and financial transparency, two top priorities for housing property management.
With one platform, managers can:
-
Monitor EV usage in real time across all locations
-
Track cost efficiency and energy consumption
-
Generate clear, visual summaries for monthly reporting
-
Communicate transparent pricing to residents
-
Optimize energy usage to lower shared electricity costs
For housing associations, this combination of automation, visibility, and data reporting helps build trust with residents while promoting sustainable energy use.
More Articles
How KotiCharge Helps Users to Split Tehomaksu Cost Fairly and Avoid Tehomaksu Cost
Miten KotiCharge-hallintapaneeli auttaa havaitsemaan latauslaitteen varhaiset viat
KotiCharge Supports Harju Elekter Charger